Working hours of a start-up employee
200 lines of code (Python)
From November 2017 until July 2019 I worked for a seed-funded Berlin start-up. During most of this time I tracked my working hours. In this post I analyse these data.

Start-up working hours
During the roughly one and a half years in Berlin’s start-up scene, I learned more than during the equivalent time in university. So, I count myself lucky for having gained practical data science experience and learning a lot about business practices along the way. However, without a considerable time investment this would not have been possible.
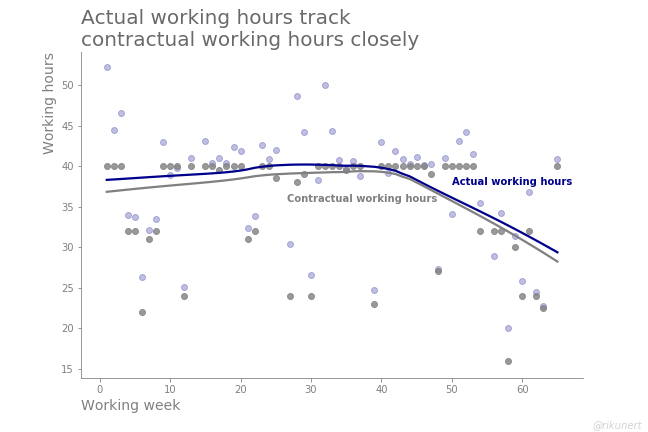
How much time did I invest? The following scatter plot shows the working hours on the x-axis and the hours I should have worked in grey. The hours I actually worked are shown in blue. Each dot represents one week. I include a LOESS-fit for orientation.

My contract said 40 hours per week and as a result most of the grey dots are arranged at that height. However, due to team events and holidays many other weeks feature less contractual work time.
My actual working hours shown in blue track the grey dots quite closely. In a sense this is not surprising. Taking a whole day off reduces both the hours you should work and the hours you actually work.
Both lines dip down towards the end of my employment because I saved up holidays. I took many days off just before I left and thereby reduced my working hours.
The blue LOESS-fit line for the actual working hours lies mostly above the grey LOESS-fit line of the contractual working hours. This is an indication that doing extra hours was common. In order to zoom in on this aspect of the data, I plot the actual weekly extra hours as a percentage of the contractual working hours.

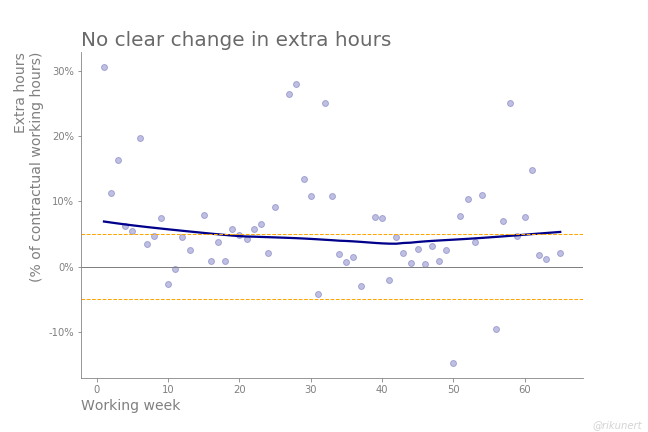
Each dot represents one week’s extra hours. The grey line represents the ideal case of no extra hours. The orange line represents a 5%-range around the zero line. I would consider 5% extra hours more or less normal. That would come down to two hours in a forty hour week.
It is difficult to discern a clear development in extra hours during the one and a half years. The LOESS-fit even slightly increases during the end of my employment even though at that point it was clear I’d leave.
A potential extra hour compensation scheme
There are many ways in which organisations can compensate their employees for extra hours. A common one is career advancement. Alternatives include time and money.
In this blog post I won’t pick sides as to how extra hours should be compensated. I would argue though that they should be compensated somehow.
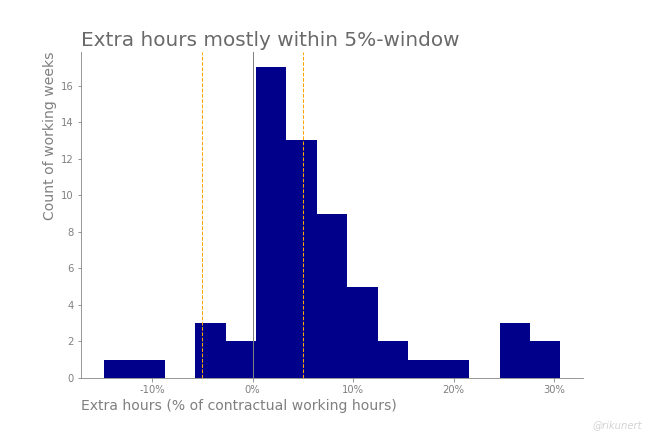
As mentioned above, a 5%-range around the contractual working hours is probably inevitable. Anything beyond that should be compensated somehow, I believe. This comes down to the working weeks outside the orange lines in this histogram.

How do the weeks with and without extra hours compare?
| extra hours | number of weeks | hours outside 5% range |
|---|---|---|
| less than 5% | 2 | 5 |
| within 5% range | 31 | 0 |
| more than 5% | 27 | 69 |
31, of the 60 weeks for which I have data, lie within the 5%-range. 27 weeks are above, totalling 69 extra hours beyond the 5%-limit.
Conclusion
Working in the Berlin start-up scene was a thrilling ride. While I learned a lot, the ride took its toll in terms of working extra hours. Whether the benefits outweigh the costs, is a personal decision. An analysis, like the one presented here, can help to ground the decision in data.
The complete code to recreate the analyses and plots of this blog post can be found on github here.
Like this post? Share it with your followers or follow me on Twitter!