The tricky question of how long it takes for Corona cases to double
260 lines of code (Python)
The doubling time of Covid-19 cases has become one of the key metrics of the Corona pandemic. Political decision makers use this number to decide when to ease lockdown measures. In this blogpost I show that different assumptions about the virus epidemic lead to different doubling time estimates. Which number should you trust?
The Covid-19 situation in Germany
Compared to other countries, Germany has handled the corona pandemic quite well so far. Today (8 April 2020) there are about 100,000 confirmed cases in total. Below, I plot how this number increased since the end of February.
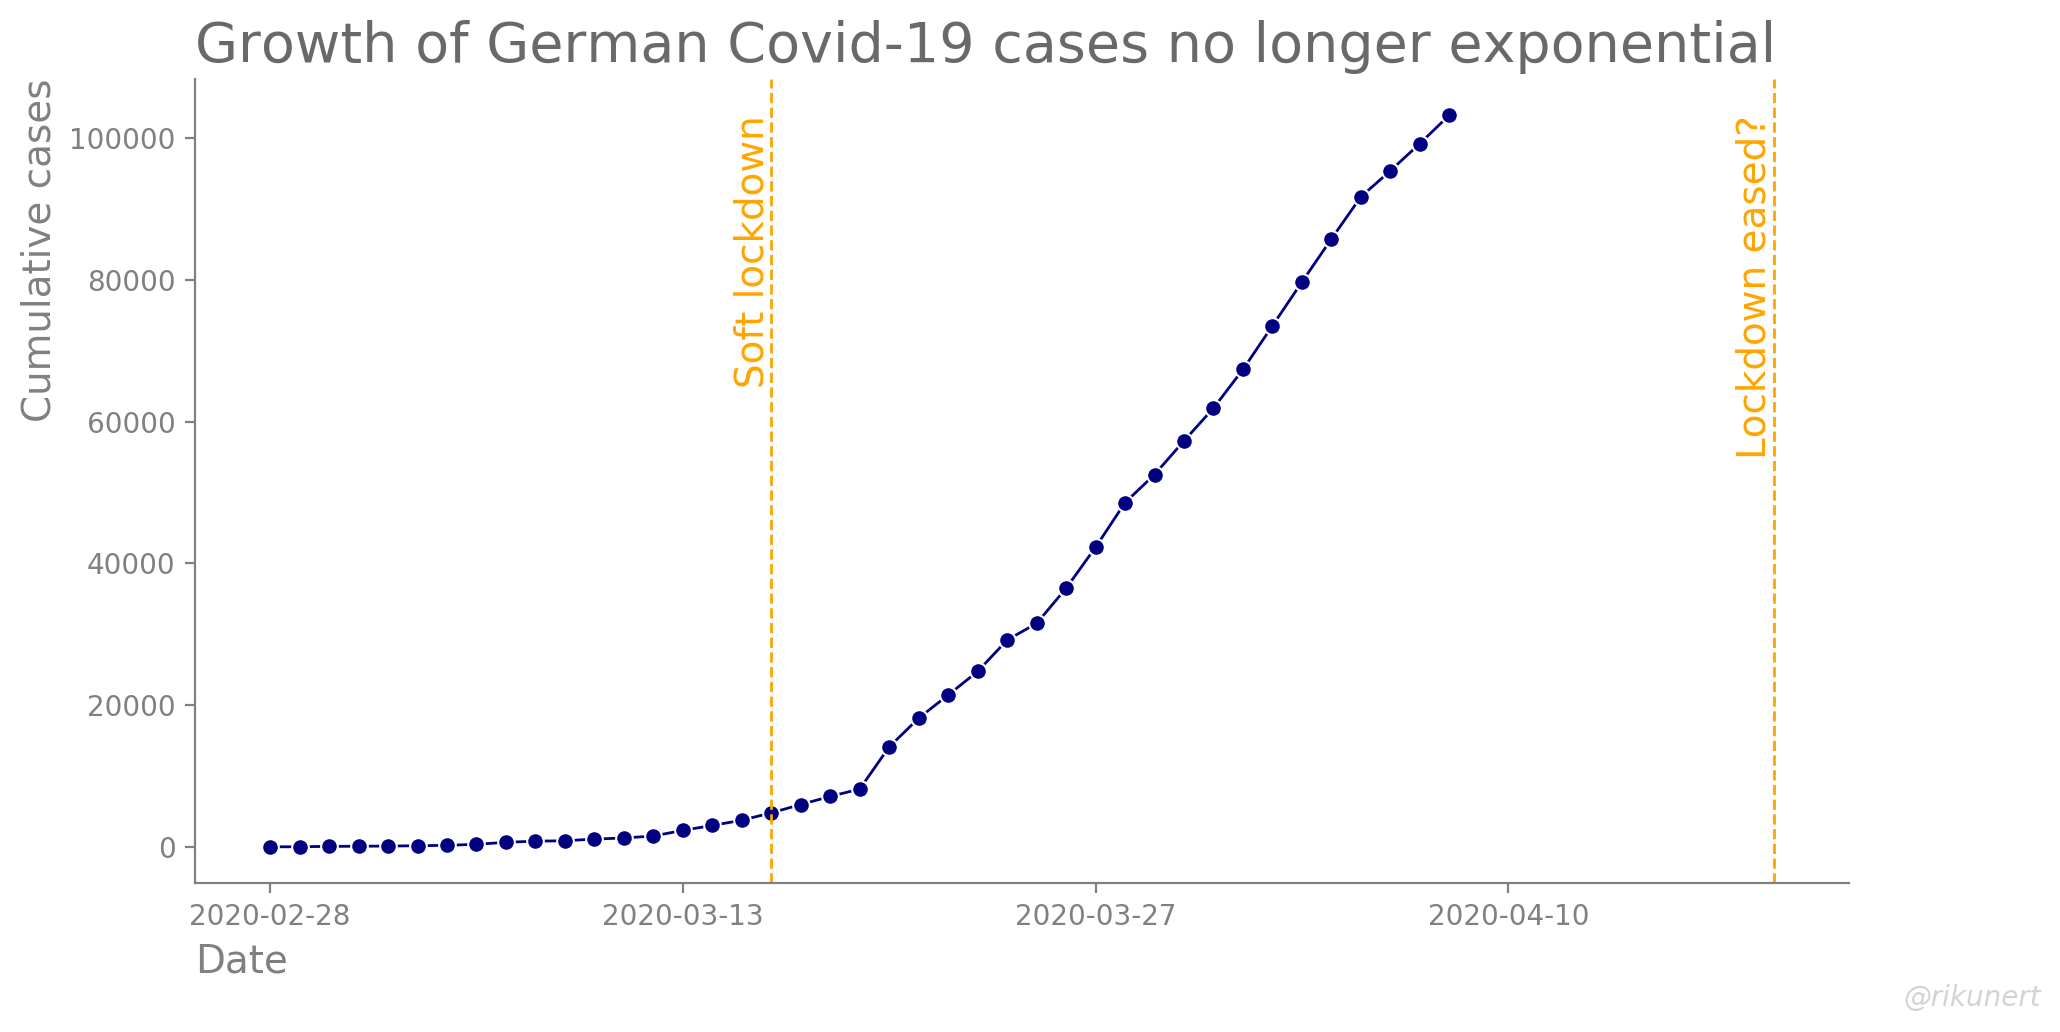
After initially very slow growth, the number has been nearly exploding since mid March. In response, the German government has instituted a soft lockdown on 14 March. Schools, universities, most shops, gyms, theatres, you name it. It’s all closed.
On 19 April the government wants to decide whether to ease the restrictions. These two dates have been marked with orange dashed lines in the figure above.
The soft shutdown, in conjunction with many other measures, has been remarkably effective. Confirmed cases no longer grow exponentially, i.e. each infected person doesn’t lead to more than one new infection. Instead, it seems as if total cases have been growing linearly lately.
This is confirmed when looking at the number of new Covid-19 cases added each day. Below, I plot this number over time. In order to smooth out the effect of terrible case number reporting during weekends, I use a seven day moving average.
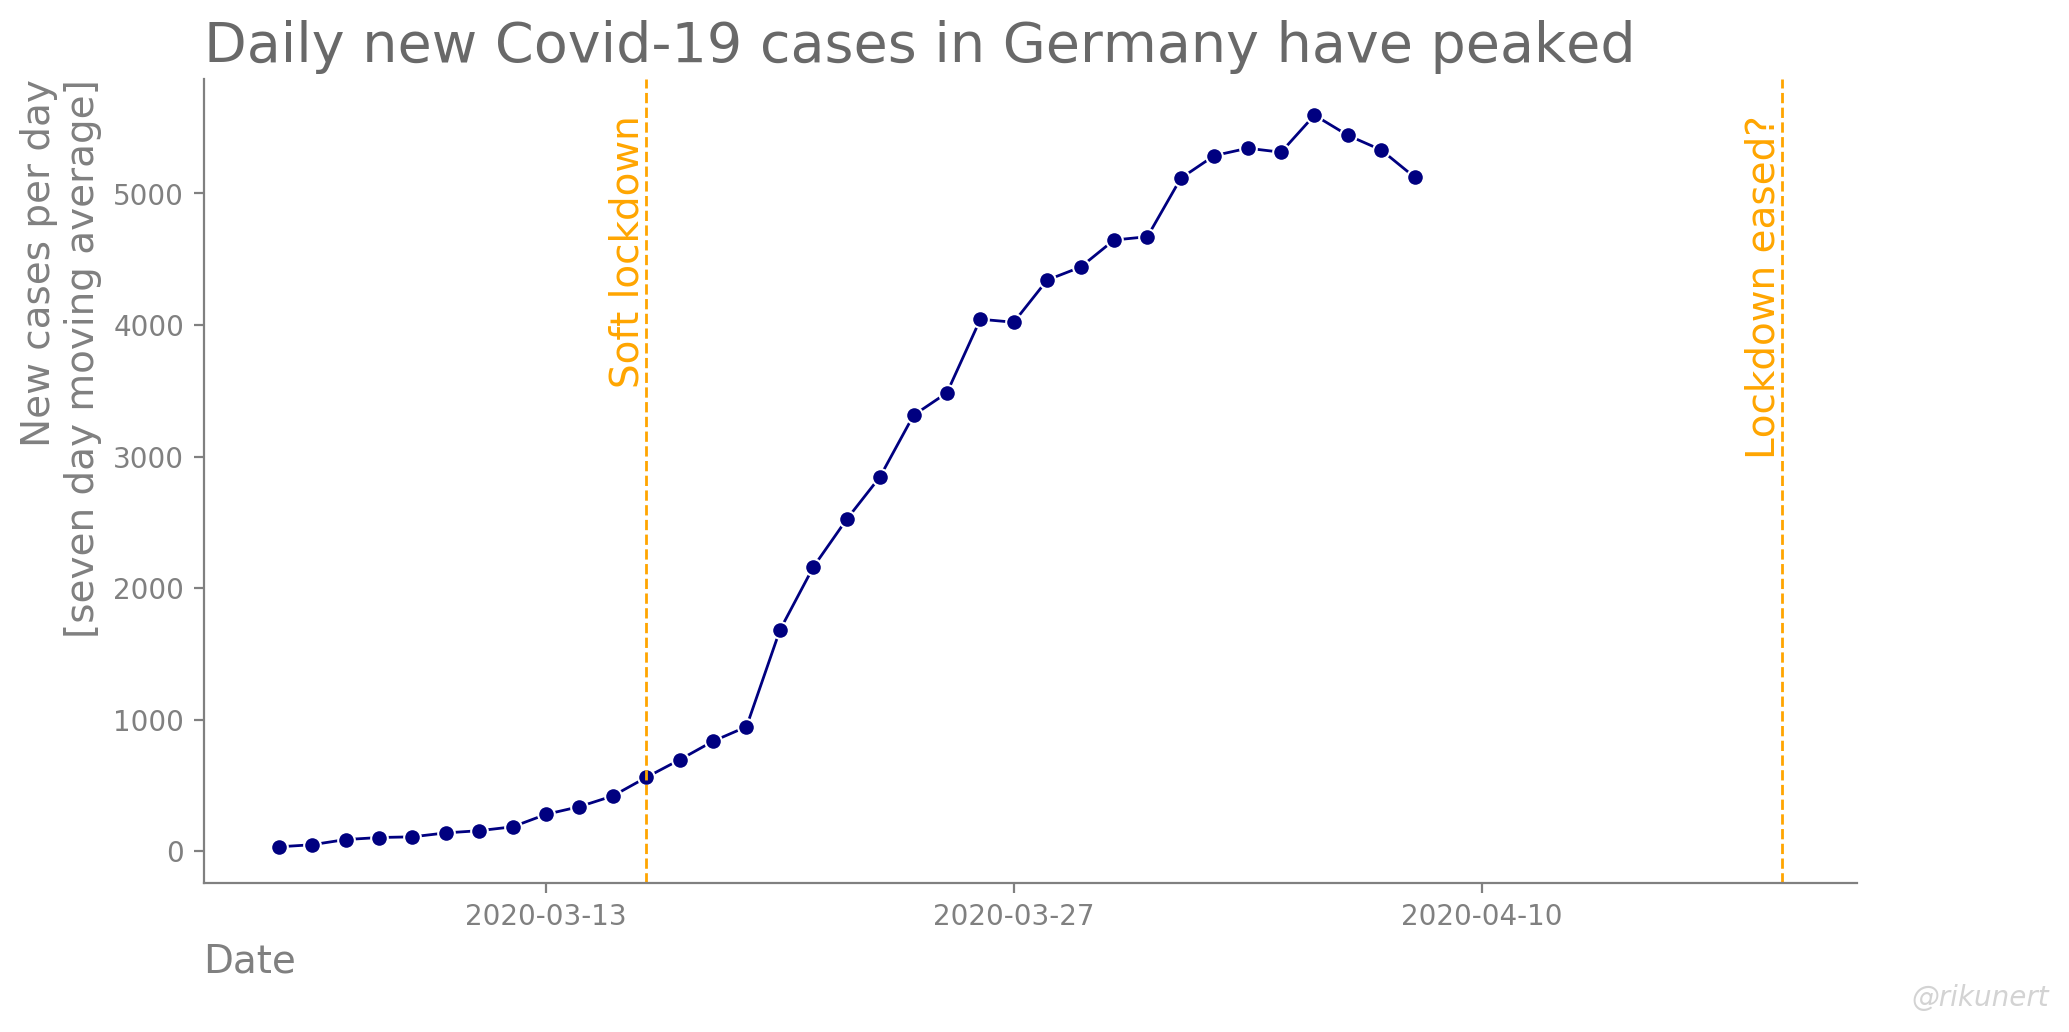
As you can see, initially the number of new cases increased every day. However, this development has stopped at a number of round about 6,000 new cases per day. That confirms the impression of the total cases above. Rather than adding a multiple of existing cases each day (exponential growth), a constant number is added to the total number of confirmed infection cases each day (linear growth).
Whether to lift restrictions on 19 April or not is dependent on many factors. The federal government clearly quantified one such factor: the doubling time of the total number of Covid-19 cases should be at least 12 to 14 days. How does one calculate the doubling time?
The actual doubling time of Covid-19 cases
Naively, I thought that one simply looks back at how long it took for cases to double. For example, currently there are 100,000 cases. How long ago were there half as many cases, i.e. 50,000 cases? On 29 March there were a bit more than 50,000 cases and a day earlier a bit fewer. That’s 10 or 11 days ago. Let’s be conservative in our estimate and say 10 days.
This kind of calculation can be carried out for each day of the epidemic. As a result, one gets a sort of retrospective doubling time. For Germany, it looks like this.
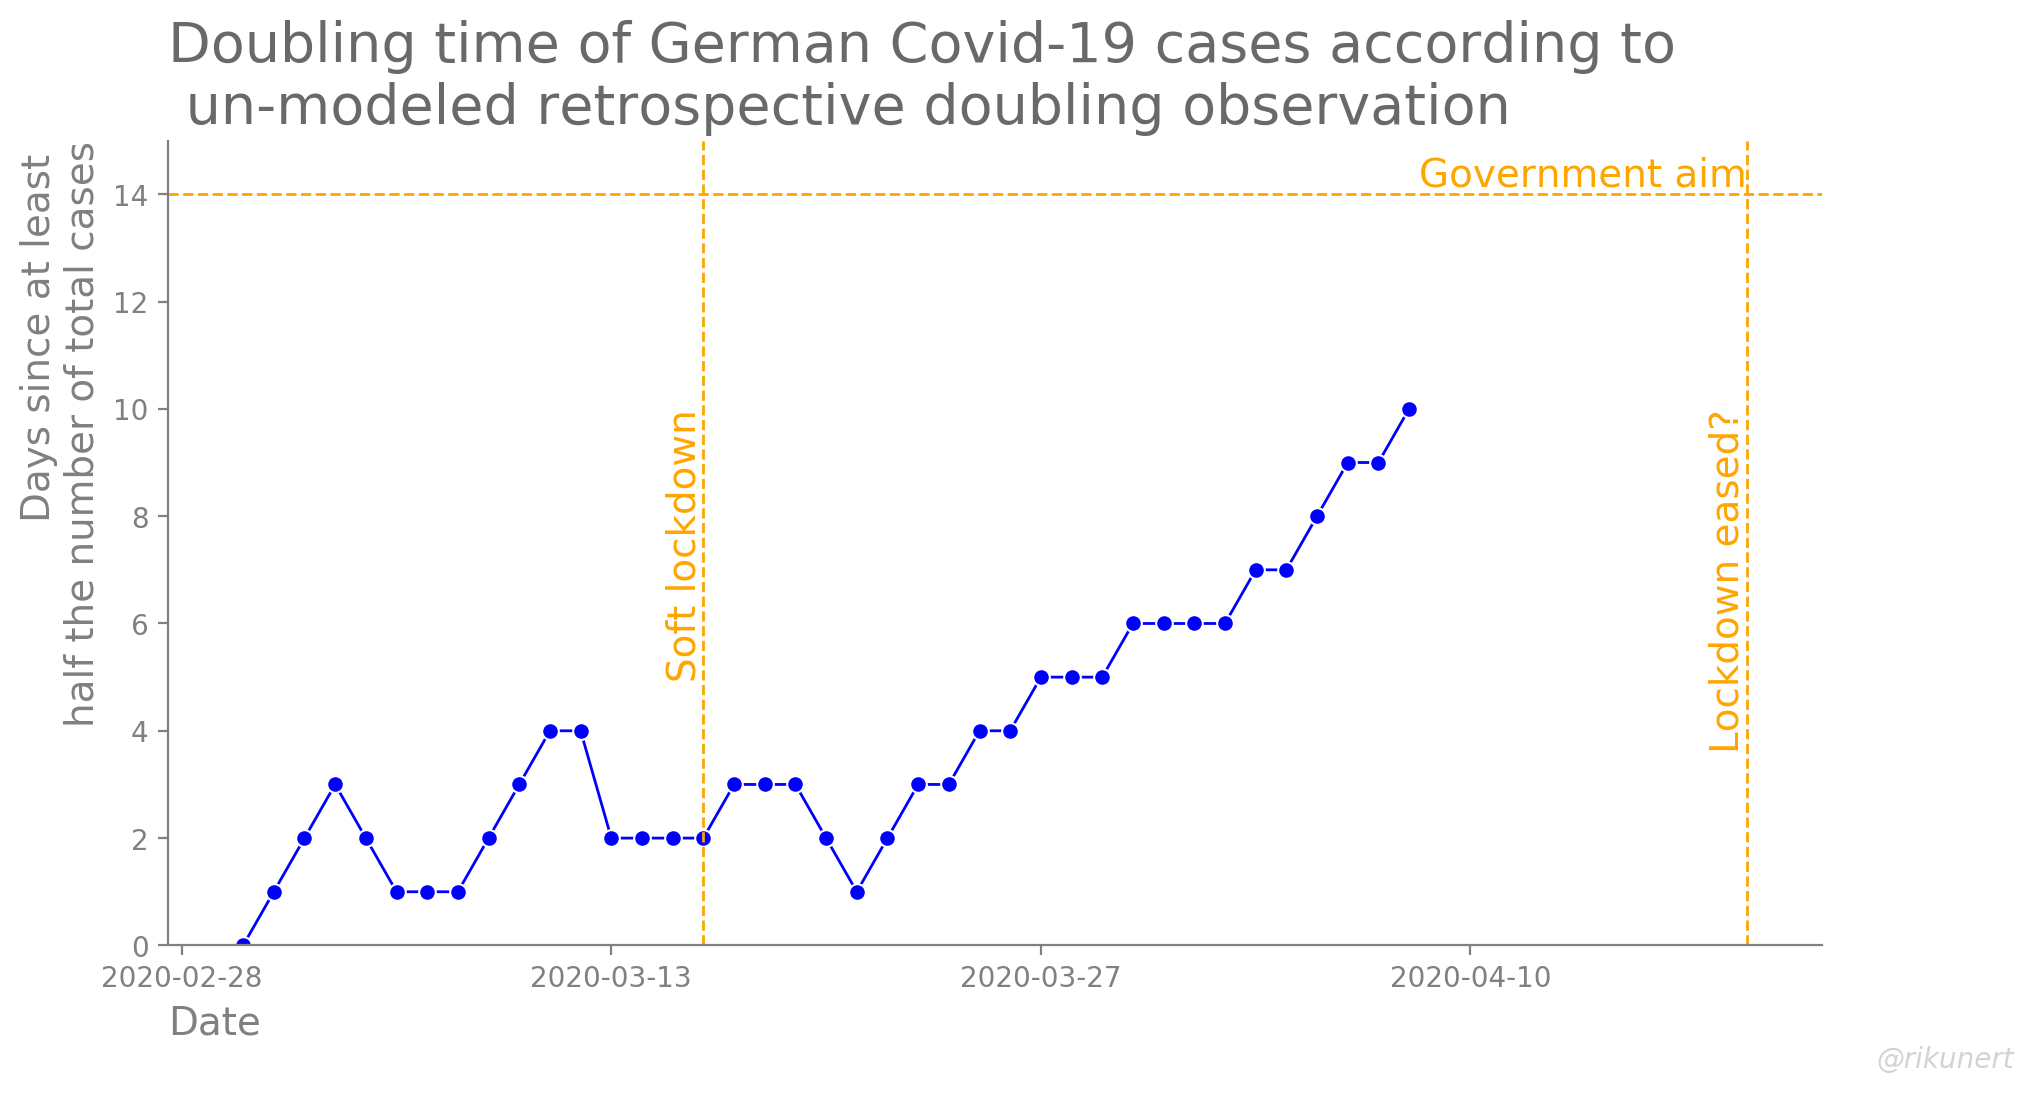
The higher the curve the better. The aim of the German government is marked with an orange, horizontal line. While we aren’t quite there yet, the development is in the right direction.
The widely reported doubling time of Covid-19 cases
When I checked my numbers against those of mainstream media outlets, I noticed that my estimates were very different to theirs. After some digging I found out that one typically uses an exponential model in order to estimate the prospective doubling time. That approach is completely different to the retrospective doubling time estimate I showed above. So, let me walk you through it.
First, you calculate the per cent increase in total cases from day to day. If you do this for every day of the outbreak and apply a seven day moving average, you get this.
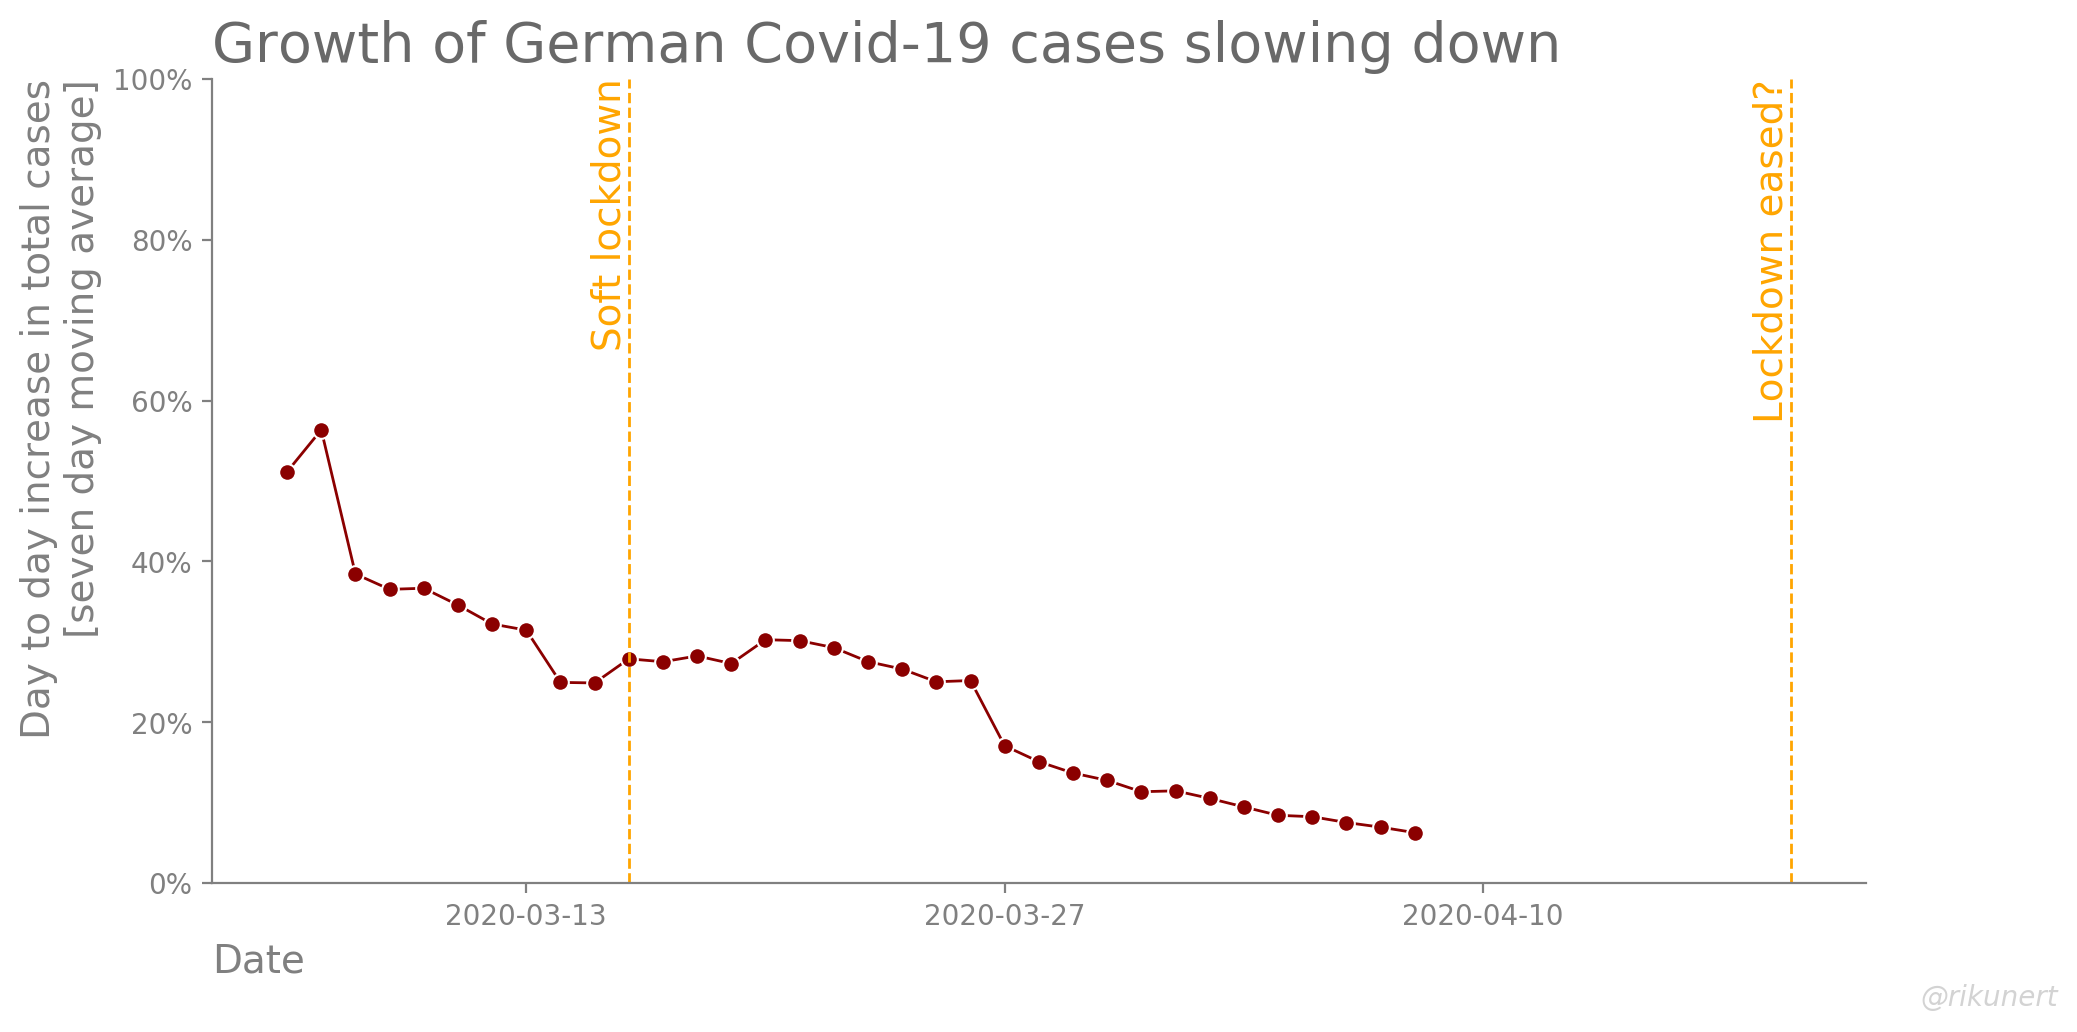
Second, you assume for each day, that the percent increase continues indefinitely and calculate how long it would take for cases to double under this assumption. I handily found the formula for this calculation here. Using such an exponential model, the German government’s 14 day aim translates to a 5.1% day to day increase.
For easier comparison, we can recalculate the day to day per cent increase into the number of days it would take for cases to double, assuming an exponential model. The result looks like this.
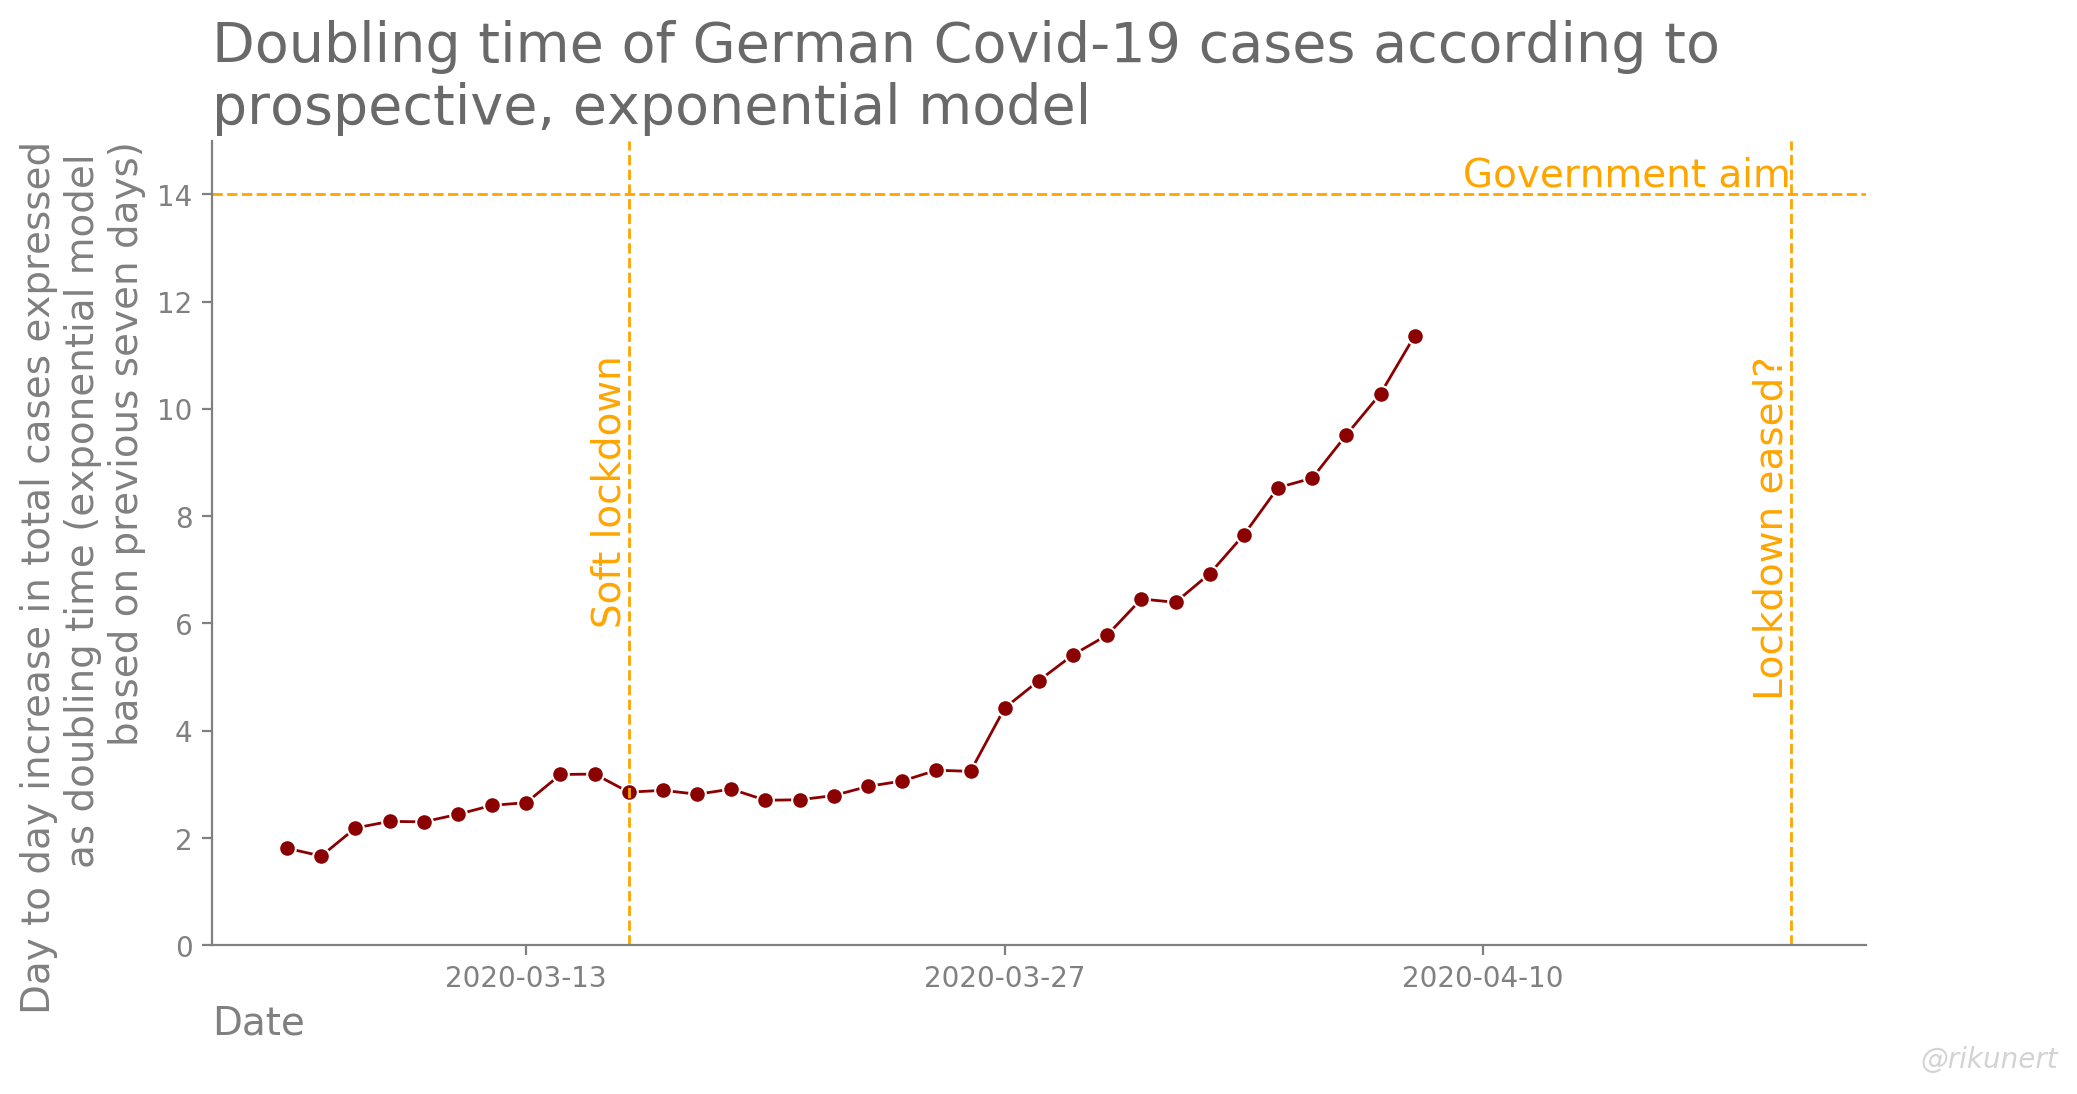
While data sources vary and the moving window size is different for different sources, this is the doubling time that is widely reported. It is already within the 12 to 14 day window which the German government aims for.
An alternative, linear prospective model of Covid-19 doubling time
Personally, I find it odd to use an exponential model to calculate the doubling time of total Covid-19 cases. We have seen above that for quite a few days now the number of confirmed Covid-19 cases no longer increases exponentially but it instead seemingly linearly. What happens if we assume a linear model of case growth?
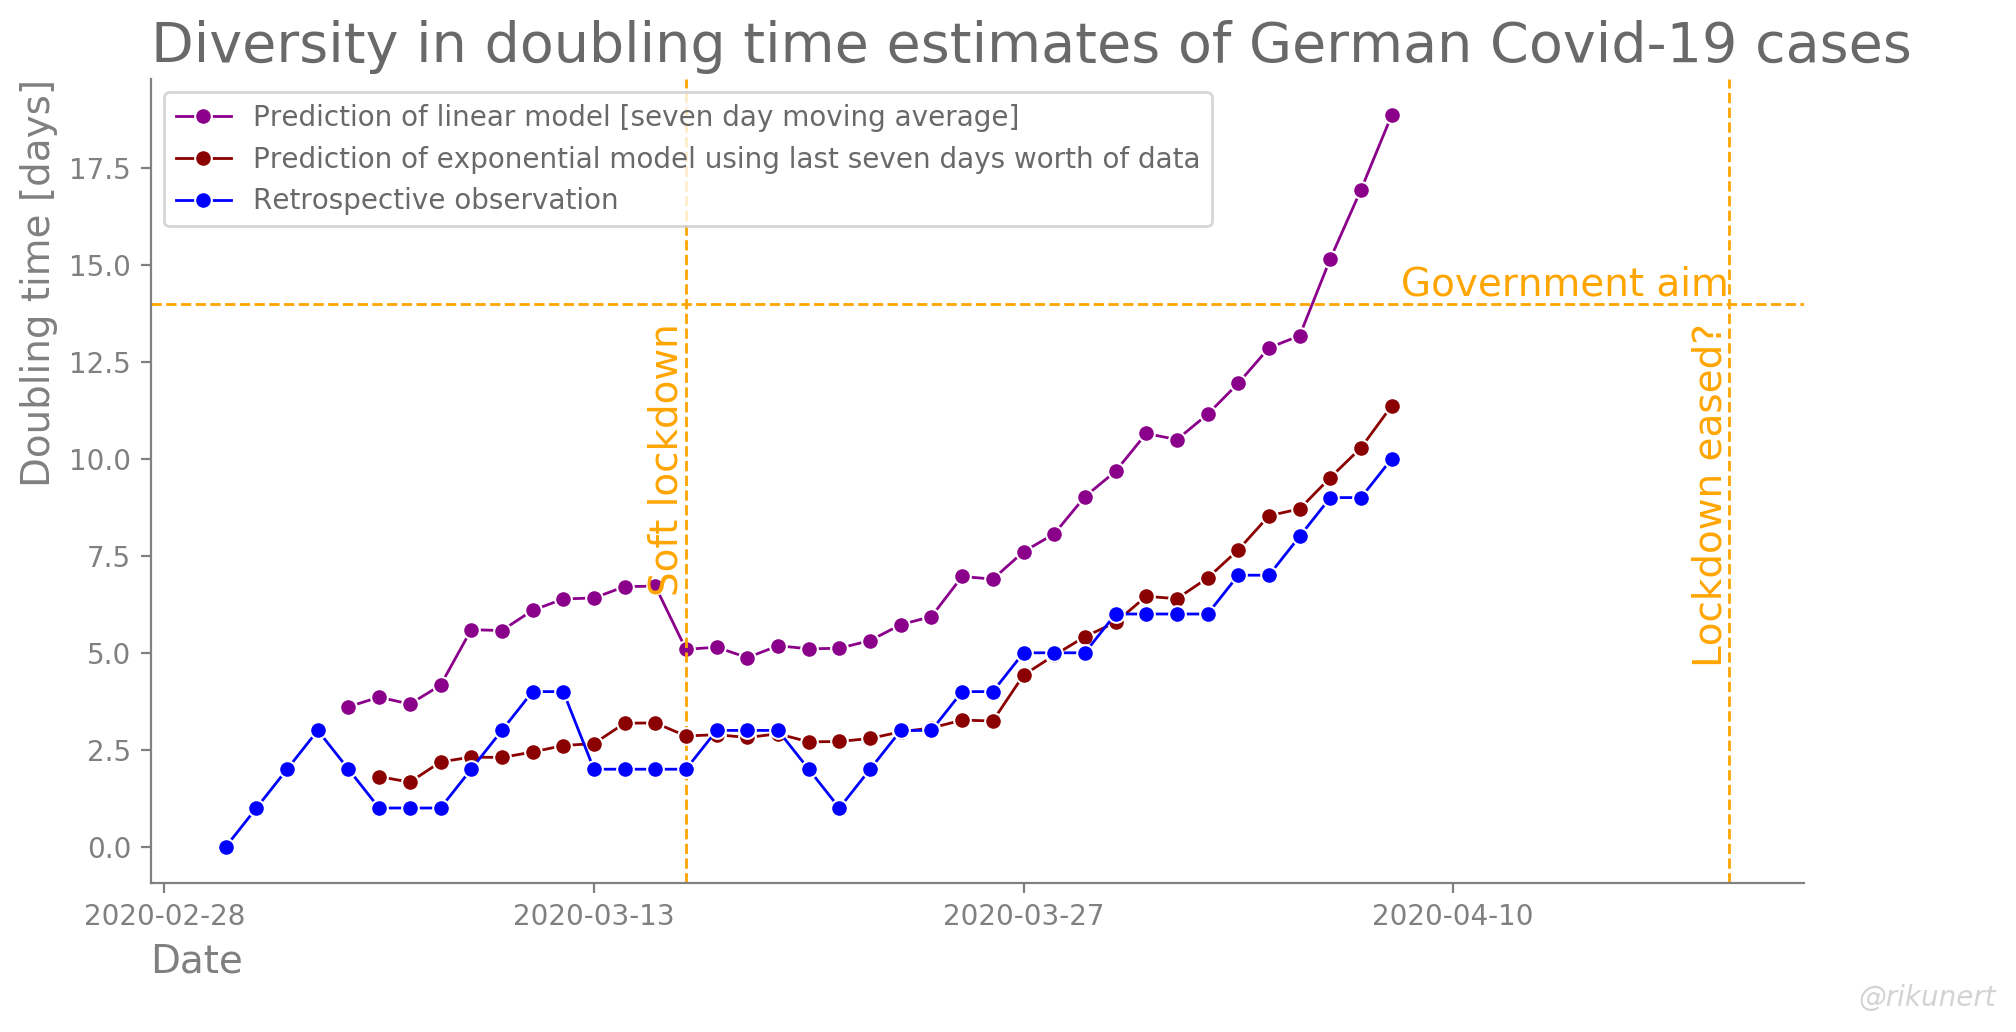
The model assumes that the number of absolute new cases per day remains constant (currently about 6,000). The time it would take for the case count to double under this assumption is then the doubling time. The resulting doubling times look like this.
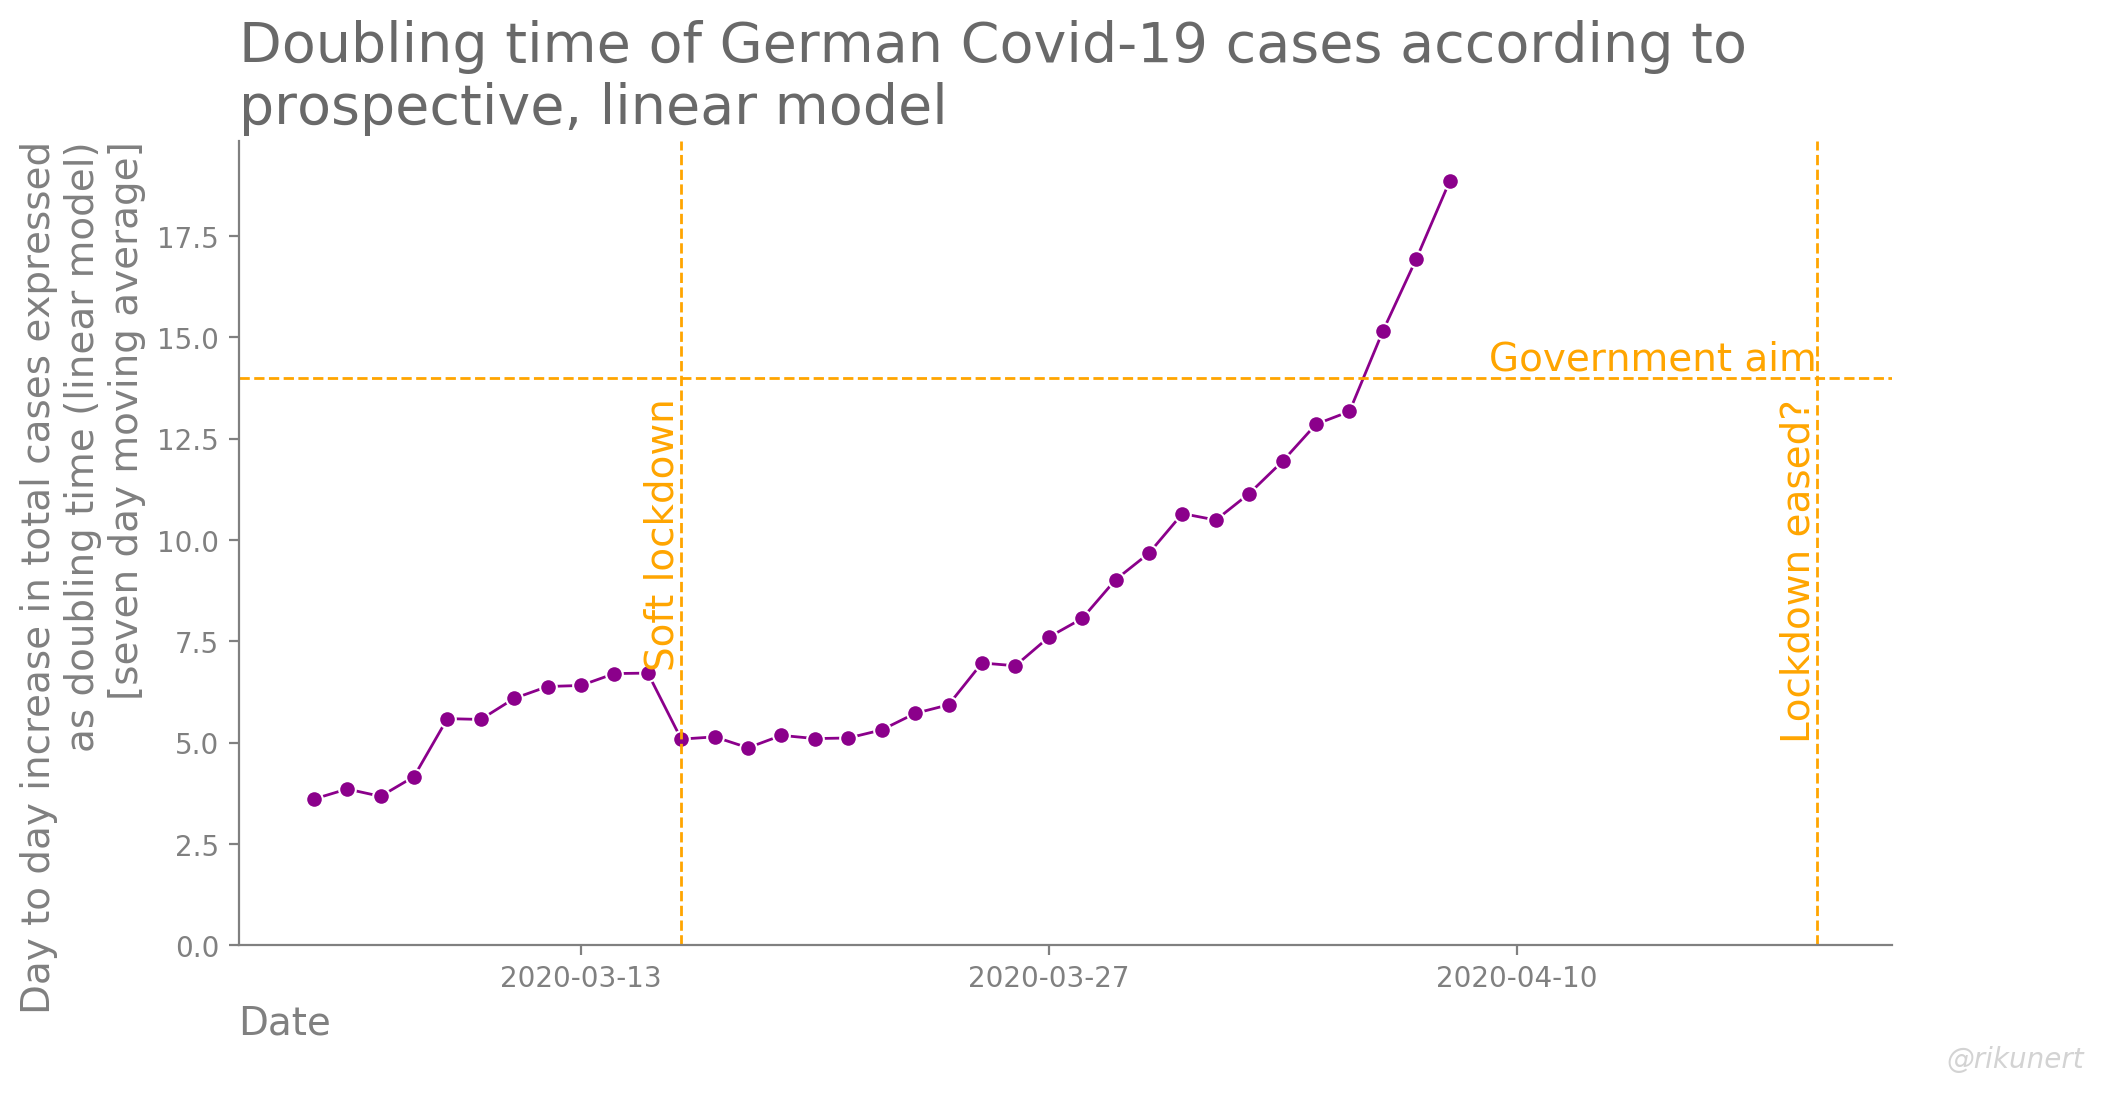
The prospective doubling times based on the linear model are a lot more optimistic than those based on the exponential model. If the German government followed this model, it would have to conclude that the doubling time is already above the 14 days they aimed for.
Conclusion
Time will tell whether it will have taken 10 days (retrospective model), 13 days (prospective, exponential model), or 19 days (prospective, linear model) for Germany’s confirmed Covid-19 cases to double. By the end of this month we will know for sure. Either way, the data show that Germany’s approach has been quite successful in slowing the growth of the epidemic. Whether it is already time to leave this path is debatable. It all depends on which estimate of the doubling time one should trust.
The complete code to recreate the analyses and plots of this blog post can, as always, be found on github here.
PS: Special thanks to the European Centre for Disease Prevention and Control for making Covid-19 data very easily accessible. If you want to start exploring them yourself, you only need these three lines of Python code:
import pandas as pd
ecdc_data_url = r'https://opendata.ecdc.europa.eu/covid19/casedistribution/csv'
df = pd.read_csv(ecdc_data_url, parse_dates=['dateRep'], dayfirst=True)
Why it is preferrable to use this data source rather than the WHO is best explained here.
Like this post? Share it with your followers or follow me on Twitter!