Modelling rating data correctly using ordered logistic regression
70 lines of code (Python)
Using rating data to predict how much people will like a product is more tricky than it seems. Even though ratings often get treated as if they were a kind of measurement, they are actually a ranking. The difference is not just academic. In this blog post I show how using an appropriate model for such data improves prediction accuracy.

Wine ratings are ordinal data
It is very common to assess the quality of a product by using customer ratings. People have no trouble putting a number on how much they like something. Companies love this sort of data as it offers a way to predict what customers will appreciate and what they will hate. However, how does one use such data best in order to derive optimal predictions?
Very often ratings get treated like a kind of measurement, i.e. as if they were on an interval or ratio scale. Assuming a rating scale from 0 (very bad) to 10 (excellent), such an analysis treats a rating of 2 as twice as good as a rating of 1. Similarly, a rating of 4 is treated as twice as good compared to a rating of 2.
Unfortunately, there is no guarantee that raters thought of the scale in the same way. We only know that a rating of 2 is better than a rating of 1, but we don’t know by how much. Such data is essentially a ranking, i.e. ordinal data. It’s better to think of ratings as categories which are ordered from very bad to excellent.
Let’s take an example. I will use a data set of 4898 Portuguese white wine ratings found here originally published by Cortez et al. (2009). Each of the wines was tasted by at least three “sensory assessors” using a blind rating procedure. The final score is the median of the individual ratings whereby zero represents “very bad” and ten “excellent”.
We start off by importing the data directly from the Internet and saving it in a DataFrame called df.
import pandas as pd
df = pd.read_csv('https://archive.ics.uci.edu/ml/machine-learning-databases/wine-quality/winequality-white.csv', sep=';')
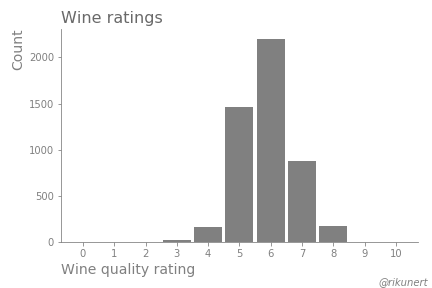
The wine ratings appear approximately normally distributed.

Modelling ratings
If we think of ratings as a kind of measurement, their prediction is a regression problem. I will assess the resulting accuracy of this approach using a multiple linear regression.
If, on the other hand, we think of ratings as categories, their prediction is a classification problem. I will assess the resulting accuracy of this approach using logistic regression. In this scenario, each sample could be classified into one of 11 categories. We solve this multiclass classification issue by trying out both a one versus the rest scheme and a multinomial approach.
Actually the data are neither on an interval/ratio scale (justifying a linear regression) nor on a nominal scale (justifying a logistic regression).
Instead, ratings are on an ordinal scale.
Ordered logistic regression, as implemented in the mord module, can accurately model such data.
Does it perform better than linear or logistic regression?
Let’s prepare the model evaluation.
# choose models
from sklearn.linear_model import LinearRegression, LogisticRegression
from mord import LogisticAT

# instantiate models
model_linear = LinearRegression()
model_1vR = LogisticRegression(multi_class='ovr',
    class_weight='balanced')
model_multi = LogisticRegression(multi_class='multinomial',
    solver='lbfgs',
    class_weight='balanced')
model_ordinal = LogisticAT(alpha=0)  # alpha parameter set to zero to perform no regularisation
Magnitude predictions
Unfortunately, there is no easy way of easily evaluating ordinal predictions. So, I will evaluate them both as if they were on an interval/ratio scale (the accuracy of the predicted rating magnitudes) and as if they were on a nominal scale (the accuracy of predicted rating categories).
I will use five-fold cross-validation to assess the performance of the models trained on a randomly chosen 80% of the data. The ratings in the remaining 20% of the data are predicted. The absolute difference between predicted ratings and actual ratings gives a sense of the accuracy of each model.
The following code implements exactly this.
from sklearn.model_selection import cross_val_score
from sklearn.metrics import mean_absolute_error
from sklearn.metrics import make_scorer
import numpy as np

# divide df into features matrix and target vector
features = df.iloc[:, :-1]  #all except quality
target = df['quality']

MAE = make_scorer(mean_absolute_error)
folds = 5

print('Mean absolute error:' )
MAE_linear = cross_val_score(model_linear,
    features,
    target,
    cv=folds,
    scoring=MAE)
print('Linear regression: ', np.mean(MAE_linear))
MAE_1vR = cross_val_score(model_1vR,
    features,
    target,
    cv=folds,
    scoring=MAE)
print('Logistic regression (one versus rest): ', np.mean(MAE_1vR))
MAE_multi = cross_val_score(model_multi,
    features,
    target,
    cv=folds,
    scoring=MAE)
print('Logistic regression (multinomial): ', np.mean(MAE_multi))
MAE_ordinal = cross_val_score(model_ordinal,
    features,
    target,
    cv=folds,
    scoring=MAE)
print('Ordered logistic regression: ', np.mean(MAE_ordinal))
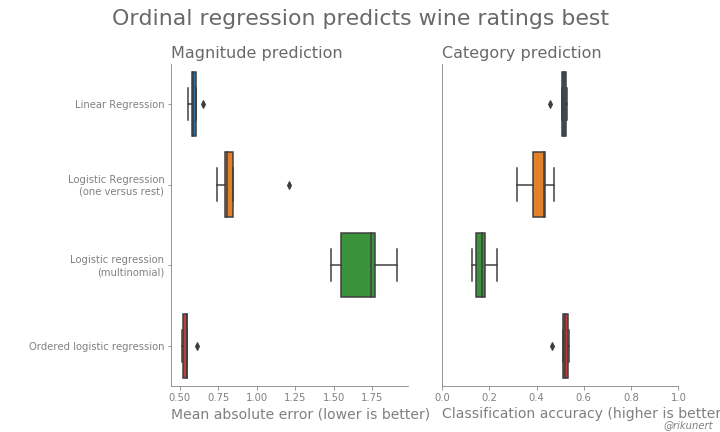
It turns out that treating rating data as ordinal data results in predictions which are very close to the actual ratings. On a scale from 0 to 10, the ordered logistic regression is on average only 0.55 off. That’s lower than the 0.59 of linear regression and the 0.87 and 1.69 of logistic regression.
| model | mean absolute error |
|---|---|
| linear regression | 0.59 |
| logistic regression (one versus rest) | 0.87 |
| logistic regression (multinomial) | 1.69 |
| ordered logistic regression | 0.55 |

Category predictions
What if we switch from a regression assessment to a classification assessment? What is the accuracy of the predicted categorical ratings?
I will again use five-fold cross-validation to assess the models. The categorical accuracy gets assessed for each fold. That is, when a predicted rating is exactly right, it’s counted as a success. Everything else is counted as a prediction failure. Accuracy is equivalent to the propotion of successes.
The following code implements exactly this.
from sklearn.metrics import accuracy_score

def acc_fun(target_true, target_fit):
    target_fit = np.round(target_fit)
    target_fit.astype('int')
    return accuracy_score(target_true, target_fit)

acc = make_scorer(acc_fun)
folds = 5

print('Accuracy:' )
acc_linear = cross_val_score(model_linear,
    features,
    target,
    cv=folds,
    scoring=acc)
print('Linear regression: ', np.mean(acc_linear))
acc_1vR = cross_val_score(model_1vR,
    features,
    target,
    cv=folds,
    scoring=acc)
print('Logistic regression (one versus rest): ', np.mean(acc_1vR))
acc_multi = cross_val_score(model_multi,
    features,
    target,
    cv=folds,
    scoring=acc)
print('Logistic regression (multinomial): ', np.mean(acc_multi))
acc_ordinal = cross_val_score(model_ordinal,
    features,
    target,
    cv=folds,
    scoring=acc)
print('Ordered logistic regression: ', np.mean(acc_ordinal))
Again, the ordered logistic regression model, which represents ratings on an ordinal scale, wins. It got 51.3% of wine ratings exactly right. That’s slightly better than the linear regression (50.7%) and much better than the logistic regression models (40.9% and 17.1%).
| model | prediction accuracy |
|---|---|
| linear regression | 50.7% |
| logistic regression (one versus rest) | 40.9% |
| logistic regression (multinomial) | 17.1% |
| ordered logistic regression | 51.3% |
It pays to treat ratings as ordinal data
Representing ratings correctly as ordinal data using an ordered logistic regression model results in better quality predictions compared to squeezing them into a linear regression or a standard logistic regression. An ordered logistic regression predicts ratings which are more often exactly correct and which on average deviate less when compared to other models. That shows that thinking carefully about what scale your data are on can pay off.
The complete code to recreate the analyses and plots of this blog post can be found on github here.
Like this post? Share it with your followers or follow me on Twitter!